
A Guide to Tracking Amazon Sales by Brand Using Seller Central Reports & Analytics
Picture two brands sitting in the same Seller Central account. One is quietly funding the other's ad spend without anyone noticing. That's what happens when sellers track total account revenue instead of tracking Amazon sales by brand. The fix costs nothing extra: two reports Seller Central already gives you, pulled and cross-referenced correctly.
This matters most for sellers in India, the USA, or the UK running several brand names under one account. It matters just as much for agencies reporting brand-by-brand P&Ls to clients. Below is the exact manual pull. It also covers why brand-level numbers behave differently from SKU or country numbers, and where a spreadsheet stops being the right tool.
Why Bother Tracking Sales by Brand Specifically?
A SKU report tells you one product is struggling. It won't tell you if that product is one weak link in an otherwise strong brand. Or if it's a symptom of a brand failing across the board.
Only a brand-level rollup answers that. It's the difference between fixing a listing and pulling budget from an entire product line.
Sellers who skip this step end up funding brands by habit rather than by performance. A brand that's been around longest keeps getting the biggest ad budget, purely because it's familiar. A newer brand can quietly outperform it per dollar spent and never get the extra push it's earned. Once brand-level data is in front of you, that guesswork disappears.
The payoff isn't only about which brand gets more ad spend next month. It's also stakeholder reporting. If you're answerable to a partner, investor, or client, a brand-by-brand breakdown changes the conversation. It turns "sales are up" into something they can actually act on.
There's a third reason this data matters, and it's easy to miss: seasonality doesn't hit every brand in a portfolio the same way. A brand selling home organization products might spike in January while a brand selling outdoor gear peaks in summer. Blend both into one account-wide number and the seasonal pattern disappears entirely, which makes forecasting for either brand nearly impossible. Split the same data by brand, and each brand's actual seasonal curve becomes visible again, which is what real forecasting needs to work from.
The Problem That Only Shows Up With Multiple Brands
Amazon permits one Seller Central account to carry several brand names. The condition: each brand has to be legitimately owned or represented by the same business. A lot of private label operations and agencies run exactly this way: one login, three or four brands, a shared catalog underneath.
That arrangement creates a risk most sellers never think about. Amazon's Inventory Performance Index is scored at the account level, not per brand. Let stock management slip on one brand, and the storage limits every other brand depends on can take the hit too.
Watching SKUs one at a time won't catch this. Watching brands as separate units will. A falling IPI trend inside one brand's numbers is your early warning before the account-wide score drops.
Ad budgets carry the same risk in a quieter form. Campaign Manager filters by portfolio. But a portfolio and a brand aren't automatically the same grouping, unless someone set them up that way deliberately.
Skip a regular brand-level check, and one brand can quietly burn a disproportionate share of total ACOS. Meanwhile a second, genuinely profitable brand goes underfunded for months, and nobody flags it. A brand-level view also makes it possible to reallocate spend intelligently through targeted Amazon advertising, instead of adjusting budgets on instinct.
Returns behave the same way. Amazon's Voice of the Customer dashboard and return-rate metrics roll up per ASIN. Nobody's building a brand-level view of that data by default.
A single brand with a design flaw driving high returns can sit unnoticed for months. Every other brand in the account looks fine, right up until that one brand's return rate starts dragging down account health metrics Amazon does track at the account level.
Brand, SKU, or Country: Which One Actually Answers Your Question
| Tracking Level | What It Tells You | When to Use It |
|---|---|---|
| By Brand | Which brand in the portfolio deserves more budget or attention | Multi-brand accounts, agency reporting, resource allocation |
| By SKU | Which single product is winning or losing | Listing fixes, restock timing, pricing decisions |
| By Country | Which marketplace is outperforming the rest | International expansion, region-specific ad strategy |
Running one brand with a small catalog? SKU-level tracking probably covers everything you need. The moment a second brand name joins the account, brand-level tracking earns its keep.
Pulling the Reports: Step-by-Step
Everything below runs off two native Seller Central reports. No paid software, no API access required, and it works whether or not a brand is enrolled in Brand Registry.
Step 1: Pull the Category Listing Report
This report is the only place in Seller Central where every SKU already carries its brand name attached. That's why it's the starting point.
Sign in to Seller Central.
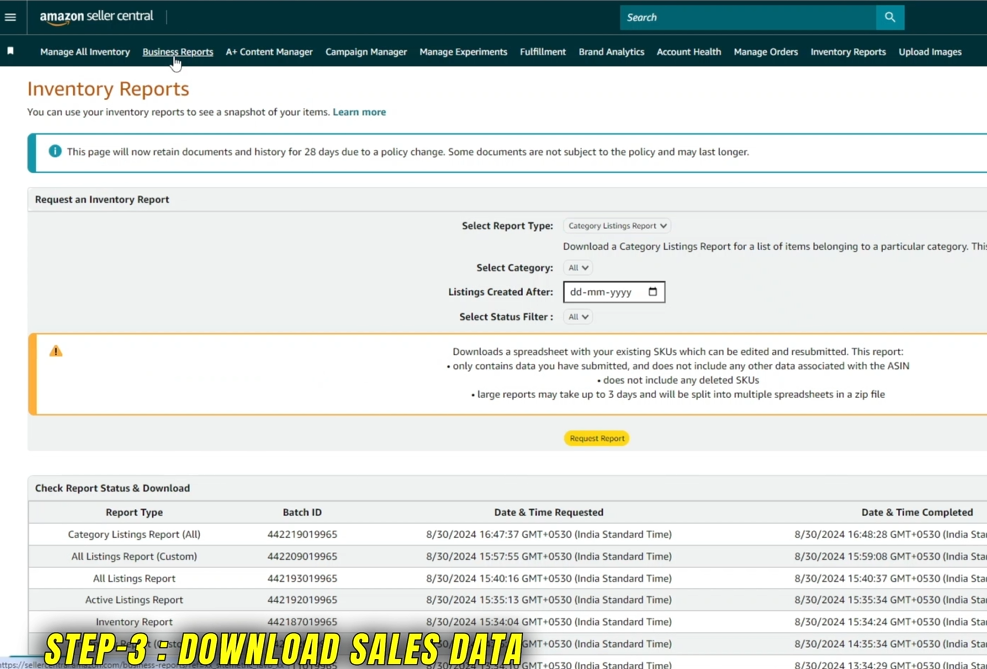
Open Reports, then Inventory Reports.
Request the Category Listing Report and download it once it's ready.
Skip this report and you're stuck manually remembering which SKU belongs to which brand. That stops working the moment your catalog crosses a dozen products. It's also why clean, consistent product listing and cataloging matters upstream of this whole exercise. A mislabeled brand field on even a handful of SKUs throws off every rollup built on top of it.

Step 2: Build a Sales-by-Brand Working Sheet
Turn that report into a working file that everything else feeds into.
Open the Category Listing Report in Excel or Google Sheets.
Pull out just the SKU and Brand columns.
Paste them into a fresh sub-sheet inside your tracking template.
Keep this sheet narrow on purpose. It only needs to answer one question: which brand does each SKU belong to. Every extra column dragged in from the source report is one more thing to untangle later.

Step 3: Pull the Sales Numbers
With the mapping ready, go get the actual revenue and units data.
Open Business Reports from the Reports tab.
Select Detail Page Sales and Traffic, which breaks down units ordered and ordered product sales per SKU.
Set your date range. Daily suits a quick check-in; monthly suits an actual budget conversation.
Download it.
Step 4: Merge and Clean the Data
Bring both reports together into one usable sheet.
Copy the SKU, Units Ordered, and Ordered Product Sales columns from the Business Report into your tracking template.
Strip the currency formatting from the sales column. Ctrl+H, replace the currency symbol with nothing, and the figures stop being read as text.
Step 5: Roll It Up by Brand
This is the step that actually turns raw numbers into a decision.
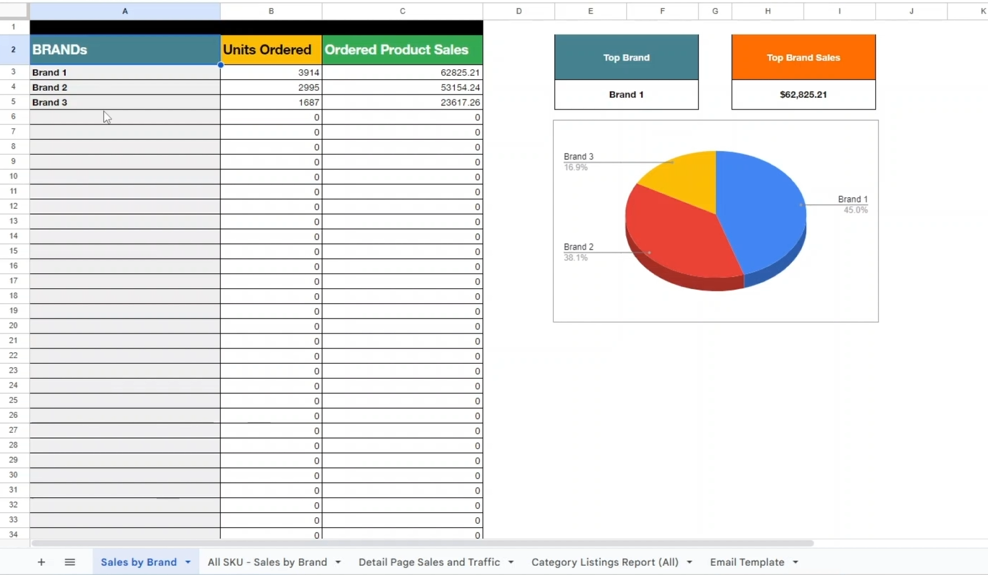
Run a SUMIF against your SKU-to-brand mapping to total units and revenue per brand.
Sort by revenue. The brand sitting at the top isn't always the one you'd have guessed off memory.
Chart it. A simple bar or pie breakdown makes an imbalance obvious in a way a column of numbers rarely does.
What Brand Analytics Adds (and Where It Falls Short)
For any brand enrolled in Amazon Brand Registry, Brand Analytics under the Brand Dashboard offers something the spreadsheet method can't reach. It surfaces search-term and market-basket data specific to that one brand's shoppers.
It isn't a replacement, though. Brand Analytics only works for registered brands. Several of its dashboards show relative percentages instead of hard revenue figures, and none of it exports through an API.
Treat it as a research add-on to the SUMIF rollup above, not the primary source. Unregistered brands don't get access to it at all, so the manual method remains the only option there.
The Search Terms dashboard inside Brand Analytics is worth a specific mention. It shows which search terms are driving clicks and conversions toward a brand's own listings versus its competitors'. The breakdown is by brand, not by the account as a whole.
Layer that alongside the revenue rollup from the manual method, and the picture gets fuller. You see not just which brand made the most money, but which search terms actually earned that brand its traffic.
Keeping This Reliable Month After Month
Pick a fixed cadence and stick to it. Monthly suits most portfolios. A brand that's scaling fast deserves a weekly look until it stabilizes, since small problems compound quickly at that stage.
Read revenue and ACOS together. A brand can post rising sales while its real margin quietly erodes if ad spend is climbing faster than revenue.
Never touch the template's structure mid-cycle. Month-over-month comparisons only hold up if the columns and formulas stay identical every single time.
Know when to hand it off. Past four or five brands, a manual monthly rollup eats hours that are better spent elsewhere in the business.
Conclusion
Tracking Amazon sales by brand isn't just an Excel exercise tacked onto the end of a busy week. It's how a stock issue in one brand gets caught before it drags down the account-wide IPI score every other brand relies on. It's also how an underfunded but genuinely profitable brand gets noticed, before a competitor eats its market share.
The manual pull above works regardless of Brand Registry status. Brand Analytics just gives registered brands one extra layer on top. Either way, the point is the same: know exactly which brand is earning its place in the portfolio, instead of guessing.
Frequently Asked Questions
Can I track sales by brand without Amazon Brand Registry enrollment?
Yes. The Category Listing Report and Business Reports method covers any brand, registered or not. Brand Registry only adds the extra Brand Analytics dashboards as a supplement, not a requirement.
How often should brand-level sales actually get reviewed?
Monthly is a reasonable default for most portfolios. Switch to weekly for a brand that's scaling fast, or one that's newly added to the account. Keep that pace until its numbers settle into a predictable pattern.
Does running multiple brands from one Seller Central account create any risk?
It can. Inventory Performance Index is scored account-wide, not per brand. A stock problem in one brand's catalog can affect storage limits for every brand sharing that account. That's exactly why brand-level tracking becomes worth doing once a second brand joins.
How is this different from tracking sales by SKU?
SKU-level data tells you whether one product is winning or losing. Brand-level data rolls several SKUs into a single portfolio view. That's what actually informs a budget or resourcing decision, rather than a single listing fix.
Is there a way to automate the monthly SKU-to-brand mapping?
Only partially. Amazon doesn't offer a native brand-level report, so that mapping step stays manual no matter what tools sit around it. Past a handful of brands, most sellers stop rebuilding the sheet by hand. They hand the ongoing reporting to an analytics tool or an agency instead.
Want Someone Else Running This Report Every Month?
Pulling this rollup once, for one brand, is a twenty-minute job. Doing it every month, for four or five brands, is a different job. On top of managing listings and ad campaigns, it's where most in-house teams quietly stop keeping up.
YourSeller builds brand-level reporting straight into ongoing account management. The numbers land in front of you already sorted, instead of buried in a spreadsheet you have to build yourself.
If a new brand is joining the account, our team also handles the seller registration process. We get the catalog properly tagged so brand-level tracking works from day one. Call +1 510-648-3933 (USA) or +91 9909513312 (India) to walk through your portfolio with us.
Also Read:
How You Can Get Your Sales by Category Report on Amazon FBA in Minutes
