
Track Amazon Sales by Country: Seller Central Reports & Analytics
When you sell across multiple Amazon marketplaces, your total revenue number hides more than it reveals. A flat or declining month might mean one country dropped while another grew — and without country-level data, you'd apply the wrong fix. Amazon Seller Central's reporting tools let you see exactly where sales are coming from, which SKUs drive each marketplace, and how performance shifts over time.
This guide walks through how to download the right Seller Central reports, use an analytics template to organize sales by country, track marketplace performance metrics, and turn that data into actual decisions — inventory, ads, and expansion strategy.
Why Track Amazon Sales by Country?
If you operate in multiple Amazon marketplaces, country-level tracking answers questions that aggregate reports can't:
Which marketplace actually drives your revenue: Your Germany (Amazon.de) sales may be growing 30% while UK (Amazon.co.uk) is declining — a blended number hides both trends.
Which SKUs perform differently across regions: A product ranking top 3 in Australia may barely move in the US. Country-level SKU data tells you where to invest in listing optimization and where to cut ad spend.
Inventory planning by market: FBA inventory is country-specific. Knowing demand by country prevents stockouts in your highest-revenue market while preventing overstocking in slower regions.
Ad spend allocation: Knowing which countries convert best lets you shift Amazon Advertising budgets toward markets with proven demand instead of spreading spend equally across marketplaces.
Expansion decisions: Before registering in a new marketplace, historical performance data from existing similar markets gives you a baseline expectation for demand and profitability.
Amazon Marketplaces by Country: Quick Reference
| Country | Amazon Marketplace | Local Currency | Seller Central |
|---|---|---|---|
| United States | Amazon.com | USD | sellercentral.amazon.com |
| United Kingdom | Amazon.co.uk | GBP | sellercentral.amazon.co.uk |
| Germany | Amazon.de | EUR | sellercentral.amazon.de |
| India | Amazon.in | INR | sellercentral.amazon.in |
| Canada | Amazon.ca | CAD | sellercentral.amazon.ca |
| Australia | Amazon.com.au | AUD | sellercentral.amazon.com.au |
| UAE | Amazon.ae | AED | sellercentral.amazon.ae |
| Japan | Amazon.co.jp | JPY | sellercentral.amazon.co.jp |
| France / Italy / Spain / Mexico | Amazon.fr / .it / .es / .com.mx | EUR / EUR / EUR / MXN | Managed via EU Seller Central |
Each marketplace has its own Seller Central account with separate report downloads. If you use Amazon's North America Unified Account or European Unified Account, you can access multiple marketplace reports from a single dashboard — but the data still downloads separately per region.
Steps to Download the Sales Reports from Amazon Seller Central

Log in to your Amazon Seller Central account for the marketplace you want to report on (e.g., Amazon.com for US data)
Go to Reports → Business Reports
Select Detailed Page Sales and Traffic by Child Item — this report breaks down sales by individual product variation (child ASIN), which lets you track SKU-level performance per country
Choose your date range — monthly is recommended for trend analysis; weekly for campaign adjustments
Click Download to export the CSV file
Repeat for each marketplace you operate in
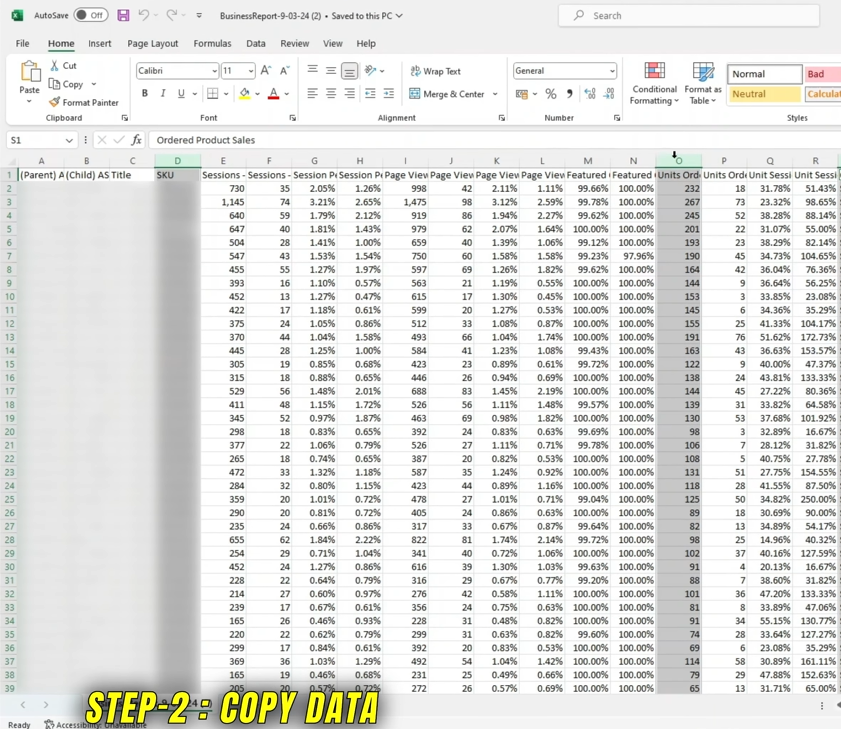
The downloaded file contains: Sessions, Page Views, Buy Box Percentage, Units Ordered, Unit Session Percentage, Ordered Product Sales, Total Order Items, and B2B equivalents for each. The key columns for country sales tracking are SKU, Units Ordered, and Ordered Product Sales.
How to Use the Amazon Sales Analytics Template
Manually comparing reports across five or more marketplaces in different currencies is time-consuming. A dedicated analytics template with one sheet per country, pre-built conversion formulas, and a consolidated summary view cuts this analysis from hours to minutes.
Template Structure
One data sheet per country: USA, UK, Canada, Australia, Germany, India, UAE, etc. — each with preset columns for SKU, Units Ordered, and Product Sales
Currency conversion column: Automatically converts local currency to USD using a single exchange rate input cell — update weekly or monthly as needed
Summary dashboard: Pulls totals from each country sheet to show consolidated revenue, top country by volume, and top SKU per marketplace
Pie chart: Auto-updated visual showing each country's percentage contribution to total revenue
Step 1: Paste Country Data
Open the downloaded Seller Central report for each marketplace. Copy the SKU, Units Ordered, and Ordered Product Sales columns. Paste them into the corresponding country sheet in the template. Repeat for each marketplace.
Step 2: Analyze Sales Data by Country
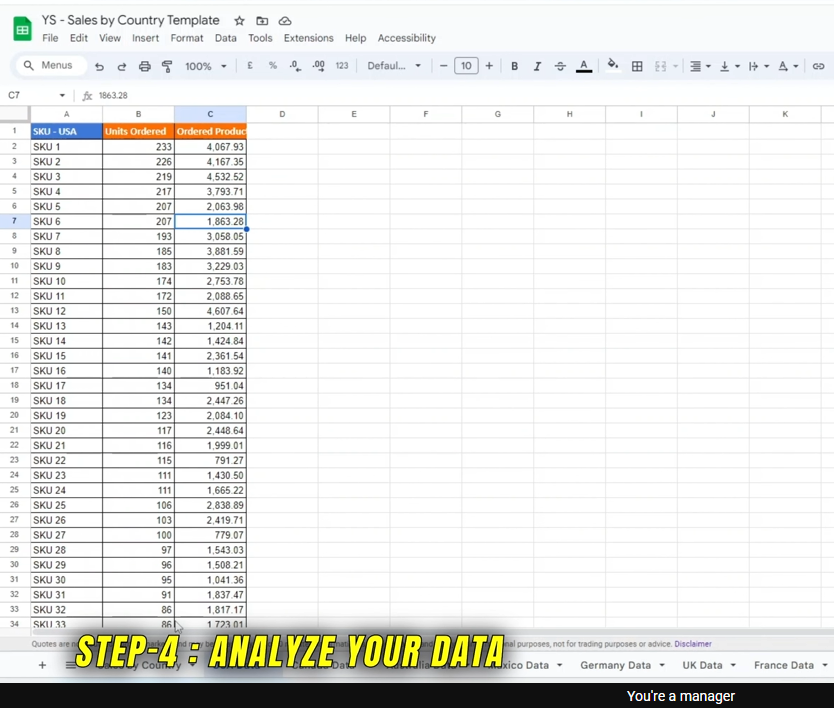
Once all country data is pasted, the summary dashboard updates automatically. Key metrics to review:
Top country by revenue (USD): Which marketplace generates the most sales after currency conversion
Units ordered by country: High units in a lower-revenue country may indicate pricing or product mix differences worth investigating
Top SKU per country: The best-performing product in Australia may not be your top seller in the US — this signals different customer preferences or competition levels
Month-over-month change: Compare current period to last month in the same template to track trajectory, not just snapshots
Step 3: Visualize Your Sales Performance
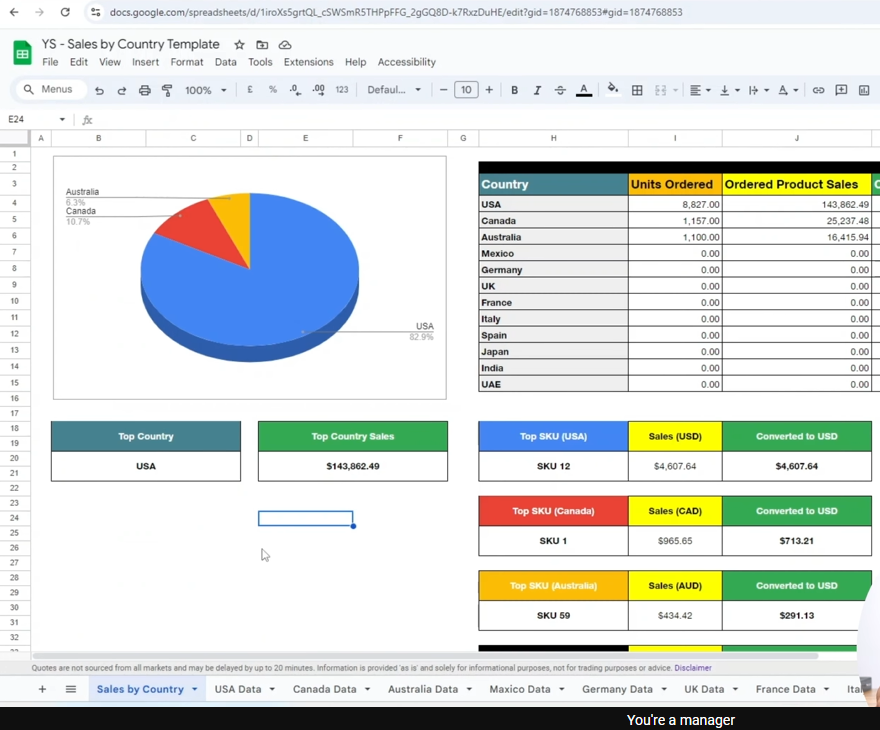
The template's pie chart shows each country's share of total USD revenue. A country capturing 60%+ of total revenue is your primary market — protect it with strong inventory levels and dedicated ad campaigns. A country at 3–5% may be a growth opportunity or a market to deprioritize depending on margin and competition data.
How to Track Amazon Sales by State Within the US
For US-only sellers or sellers whose primary market is Amazon.com, tracking performance at the state level offers a more granular view of where demand is concentrated. Amazon Seller Central doesn't provide a native state-level sales report, but you can approximate regional demand through two methods:
FBA Inventory Placement Reports: Amazon ships FBA inventory to fulfillment centers based on demand forecasting by region. The inventory placement data shows which regions are receiving the most stock — a proxy for where Amazon anticipates demand.
Amazon Advertising geographic reports: In Amazon Advertising Console, download the Campaigns report by geography. This shows impressions, clicks, and sales by US state — useful for identifying which states have the highest conversion rate for your products and adjusting ad budgets accordingly.
Amazon Attribution: If driving external traffic (Google Ads, social), Amazon Attribution provides state-level data for that traffic source.
Turning Country Sales Data Into Decisions
Raw country-level data is only useful if it changes what you do next. Here's how to convert the template output into specific actions:
| What the Data Shows | What to Do |
|---|---|
| Country A revenue up 40% month-over-month | Increase FBA inventory for that marketplace, scale ad budget, check if specific SKUs are driving growth |
| Country B has high units ordered but low revenue per unit | Test a price increase — if units are selling despite lower margins, demand may support a higher price point |
| Top SKU in Germany doesn't appear in top 5 for UK | Check if the UK listing is fully translated/localised, review competitor pricing in that market, test UK-specific ad campaign |
| Country C revenue declining for 3 consecutive months | Review listing quality, check for new competitors, assess whether FBA fees/duties have made pricing uncompetitive |
| A marketplace not yet selling has adjacent country growing strongly | Consider registering in that new marketplace — adjacent cultural markets often show similar demand patterns |
Benefits of Country-Level Amazon Sales Tracking
Smarter inventory management: Replenish by marketplace based on actual sales velocity per country — not a blended average that can leave your top market understocked
Targeted Amazon advertising: Allocate PPC budgets to the countries where your products actually convert, rather than spreading spend evenly
Optimized product listings per region: High-impression, low-conversion in a specific country signals a listing quality issue — keywords, title, or images may need localisation
Better B2B tracking: If you use Amazon Business, cross-reference country sales data with B2B vs B2C split from Business Reports to see which countries have the strongest business buyer segment — check our guide on tracking B2B and B2C sales on Amazon for the full process
Frequently Asked Questions
How do I track Amazon sales by country in Seller Central?
Go to Reports → Business Reports → Detailed Page Sales and Traffic by Child Item. Select your date range and download the report. This gives you SKU-level sales data for the marketplace you're currently logged into. To track multiple countries, repeat the process by logging into each country's Seller Central account separately and downloading the report. Then consolidate the data using a multi-country template with currency conversion formulas to compare performance across marketplaces in a common currency (typically USD).
Which Amazon report shows sales by country?
The Detailed Page Sales and Traffic by Child Item report in Seller Central Business Reports is the most granular report for tracking sales performance. Each Seller Central account covers one marketplace region — Amazon.com for US, Amazon.co.uk for UK, Amazon.in for India, etc. There is no single report that combines all marketplaces in one download. You need to download reports from each marketplace separately and then consolidate using a tracking template or spreadsheet.
Can I track Amazon sales by state within the USA?
Amazon Seller Central doesn't provide a native state-level sales report. The closest alternatives are Amazon Advertising's geographic breakdown (available in the Advertising Console under Campaign Reports), which shows ad performance by US state, and FBA inventory placement reports which indicate regional demand. Amazon Attribution also provides state-level data for any external traffic you drive to your listings.
How do I compare revenue across different Amazon marketplaces with different currencies?
Download the sales report for each marketplace separately — each report shows revenue in the local currency of that marketplace (USD, GBP, EUR, INR, etc.). In your consolidation template, add a currency conversion column for each country sheet using a consistent exchange rate (typically the monthly average from a source like XE.com or the Bank of England). This converts all revenues to USD for side-by-side comparison. Update exchange rates monthly to maintain accuracy.
How often should I pull Amazon sales by country reports?
Monthly is the minimum for meaningful trend analysis. Weekly reporting is useful when you're actively running campaigns, testing pricing changes, or managing inventory levels across marketplaces. Daily reporting is only necessary during high-volume periods like Prime Day or Black Friday, when a single day's data can significantly shift your inventory and ad budget decisions. Most sellers find monthly country-level pulls for strategic planning, combined with weekly marketplace checks during active campaigns, to be the right cadence.
Need Help Managing Amazon Sales Across Multiple Countries?
Tracking sales is the analysis side — acting on that data across multiple marketplaces simultaneously requires operational capacity most sellers don't have in-house. At YourSeller Agency, our Amazon marketplace management service covers multi-country account monitoring, inventory planning by region, and campaign management across marketplaces for brands selling in the USA, UK, UAE, India, and beyond.
Our 90-day sprint model. No long contracts. Measurable results per marketplace.
