The Best Way to Track Daily Orders and Revenue per SKU on Amazon FBA
For any Amazon FBA seller, especially beginners, understanding your daily orders, revenue, and SKU-level performance is the key to making better decisions and growing your business. Without structured tracking, you’re essentially “flying blind” in a competitive marketplace.
This post will walk you through the exact method we discovered at YourSeller, for using an Amazon sales analysis template to track daily performance, compare current and previous months’ sales, and get actionable insights for growth.
Whether you’re just starting out or refining your process, this Amazon Business Reports tutorial will show you step-by-step how to analyze sales in Amazon Seller Central and optimize your listings for better results.
Why You Need SKU-Level Amazon Sales Analysis
If you’re managing multiple products, it’s not enough to know your total sales. You need to analyze ASIN-level performance to see which SKUs are pulling their weight and which are underperforming.
Here’s why tracking Amazon's Per Day Average (PDA) Sales Analysis matters:
Spot Trends Early: Identify slow-moving items before they drain storage costs.
Optimize Inventory: Order stock in line with actual demand, avoiding stockouts or overstocking.
Improve Amazon Product SEO: Use sales trends to decide where to invest in enhanced content, keyword targeting, and PPC ads.
Make Better Decisions: Evaluate the success of promotions, seasonal spikes, or listing optimizations.
When combined with Amazon product listing services or Amazon marketplace management services, this method becomes a powerful growth engine.
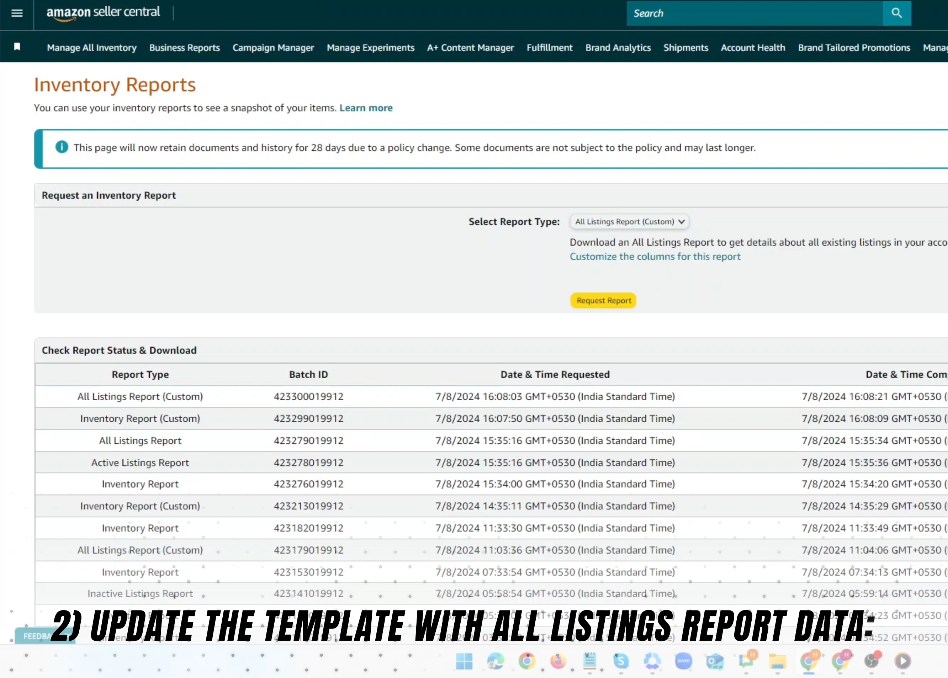
Step 1: Download the All Listings Report from Amazon Seller Central
Before you can track sales, you need a complete snapshot of your current listings. The All Listings Reports Amazon feature provides every ASIN and SKU you sell, along with crucial details like price and status.
How to Get It:
Log in to your Amazon Seller Central account.
Navigate to Reports in the main menu.
Select Inventory Reports.
In the “Select Report Type” dropdown, choose All Listings Report.
Click Request Report and wait for it to generate.
Download the report once ready.
Pro Tip: This step is needed only the first time you set up your template or whenever you add new products to your catalog.
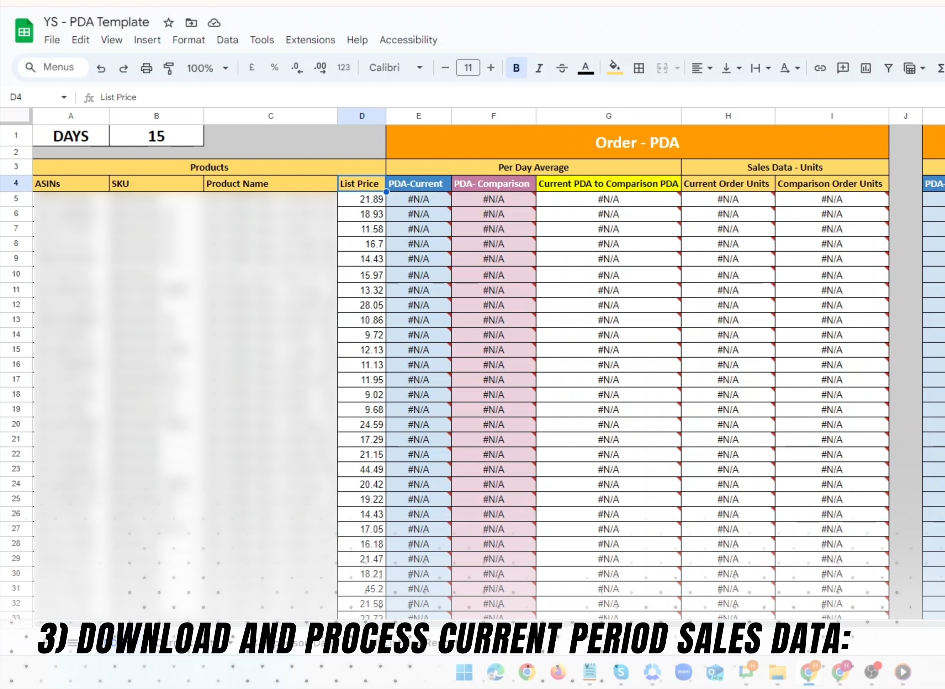
Step 2: Update the Amazon Sales Analysis Template
You’ll need an Amazon Excel template for sales insights, this is where all the data gets stored and analyzed.
To update the template:
Open the downloaded All Listings Report.
Select all the data and copy it.
In your sales analysis template, go to the All Listings Report sheet (or sub-sheet).
Paste the data there.
This ensures your template has a record of every ASIN, SKU, and price you sell.
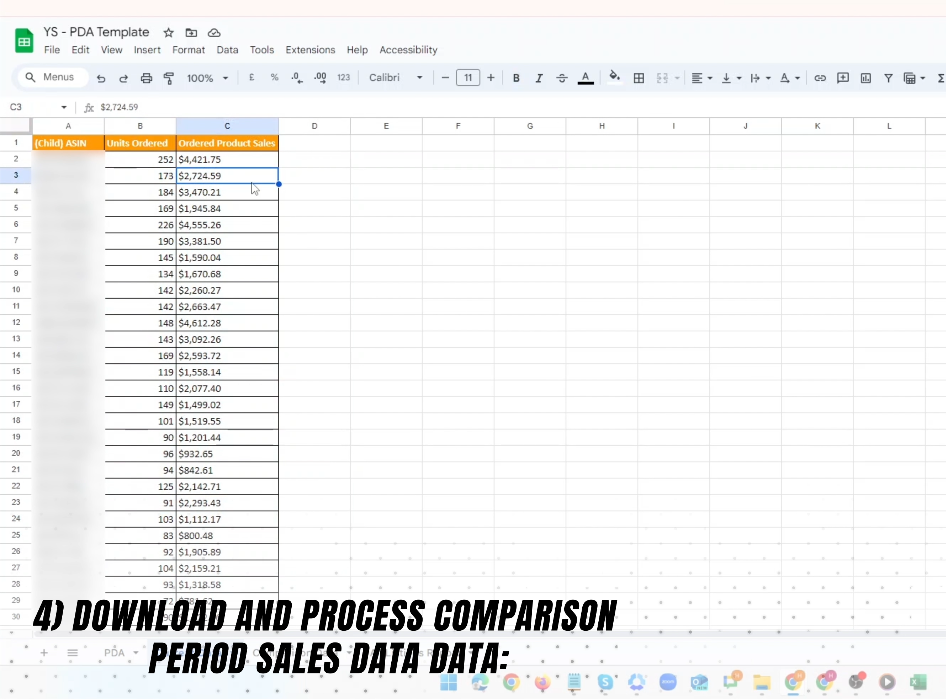
Step 3: Download and Process Current Sales Data
Now it’s time to pull in current sales performance using Amazon Business Reports.
Steps:
In Seller Central, go to Business Reports.
Select Detail Page Sales and Traffic by Child Item (this is where you can see ASIN-level stats).
Set your desired time period—for example, June 1 to June 15.
Download the report.
Copy the following columns:
Child ASIN
Units Ordered
Ordered Product Sales
Paste this data into the Current Data sheet in your template.
Step 4: Download and Process Comparison Period Sales Data
Comparing month-over-month performance is critical for Amazon seller growth analysis. It shows you exactly how your products are trending.
Steps:
In Seller Central, select the same number of days from the previous month (e.g., May 1 to May 15).
Download the report as before.
Copy Child ASIN, Units Ordered, and Ordered Product Sales.
Paste this data into the Comparison Data sheet in your template.
Step 5: Format the Sales Data for Analysis
Amazon sales reports often include currency symbols like “$” that prevent clean calculations. You need to clean them up:
How to do it:
In both the Current Data and Comparison Data sheets, select the “Ordered Product Sales” column.
Use the Replace function (Ctrl + H).
In “Find what,” type $.
Leave “Replace with” blank.
Click Replace All.
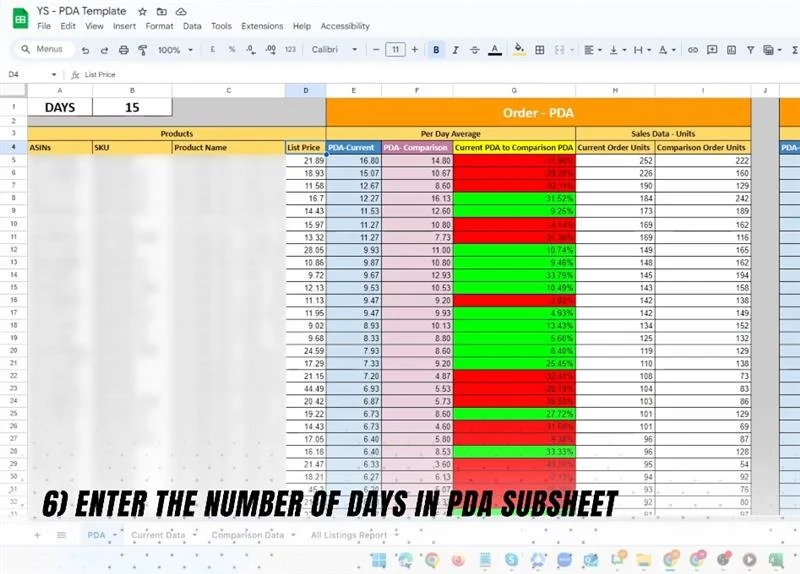
Step 6: Enter the Number of Days for PDA Analysis
The PDA (Per Day Average) Sales Analysis is the heart of this system. It calculates average orders and revenue per day for each SKU.
Steps:
Go to the PDA sheet in the template.
In the top-left cell labeled Days, enter the total number of days in your analysis period (e.g., 15 if you ran reports for June 1–15).
Step 7: Analyze Your PDA Metrics
The PDA sheet will automatically fetch and display SKU-level insights using built-in formulas.
Here’s what each metric means:
Order PDA (Current): Average daily units sold for the current period.
Order PDA (Comparison): Average daily units sold for the comparison period.
Current PDA to Comparison PDA: The percentage growth (or drop) in units sold from the previous month to the current month.
Current Order Units: Total units ordered in the current period per SKU.
Comparison Order Units: Total units ordered in the comparison period per SKU.
Sales PDA (Current): Average daily revenue for the current period.
Sales PDA (Comparison): Average daily revenue for the comparison period.
Current Order Revenue: Total revenue in the current period for each SKU.
Comparison Order Revenue: Total revenue in the comparison period for each SKU.
Step 8: Use the Data to Drive Action
The beauty of this method is that it doesn’t just give you numbers, it gives you direction.
Here’s how you can use your findings:
Boost High Performers: If an SKU shows strong month-over-month growth, consider increasing ad spend or stocking more inventory.
Rescue Low Performers: If units sold or revenue are dropping, run an Amazon product sales comparison Excel deep-dive to see if keyword rankings, pricing, or competitor activity changed.
Plan Seasonal Promotions: Spot early trends for seasonal products and plan campaigns in advance.
Optimize Listings: Pair this data with Amazon Flat File Listing Optimization to tweak titles, bullet points, and keywords for low-performing ASINs.
Benefits of This Amazon Sales Analysis Method for Beginners
Clear, Visual Insights: The PDA method organizes data in a way that’s easy to read and interpret.
Works for Any Product Count: Whether you have 5 SKUs or 500, this system scales.
Quick to Update: Once set up, you only need to update the “Current Data” and “Comparison Data” each month.
Ideal for Amazon Marketplace Management Services: Agencies can track client performance with ease.
Supports Amazon Product SEO: By tracking trends, you know which listings need keyword optimization.
How This Ties into Amazon Product Listing Services
Professional Amazon product listing services and Amazon product SEO teams often rely on this exact process to evaluate performance before making listing changes. The reason is simple: you can’t optimize effectively without knowing your current and historical performance.
By combining PDA analysis with strategic optimizations, sellers often see measurable growth in both traffic and conversions.
Final Thoughts
For Amazon FBA beginners, managing sales data can feel overwhelming. But with the Amazon Sales Analysis Template and this Amazon Business Reports tutorial, you can track Amazon SKU-level performance like a pro without expensive third-party tools.
The process boils down to three main actions:
Download the right Amazon business reports (All Listings, Current Sales, and Comparison Sales).
Feed them into your Amazon Excel template for sales insights.
Use PDA analysis to compare and act on the data.
This method not only shows you how to analyze sales in Amazon Seller Central but also lays the groundwork for more advanced analytics, such as profitability tracking, ad ROI measurement, and long-term forecasting.
Accelerate Your Amazon Sales with Proven Strategies
With our expert Amazon product listing services, we create listings that not only look great but also convert browsers into buyers. Our team specializes in Amazon product SEO, ensuring your products rank higher, attract more clicks, and drive consistent sales.
But we don’t stop there, our comprehensive Amazon marketplace management services give you end-to-end control over your store’s performance. From keyword-rich content and data-driven sales analysis to inventory optimization and competitor tracking, we handle every detail so you can focus on growing your brand.
Whether you’re launching your first product or managing an extensive catalog, we provide the insights and strategies you need to stay ahead in a competitive marketplace.
Let’s build your Amazon success story, starting today. Reach out to us at +1 510 648 3933 (USA) or +91 9909513312 (India) for any questions you may. Or, you can email us at contact@yourseller.in now to get your personalized growth plan.


