
How to Efficiently Track Amazon Search Frequency Rank (SFR) for Multiple Keywords
Amazon Search Frequency Rank (SFR) is one of the most precise keyword performance signals available to sellers — and unlike third-party keyword volume estimates, it comes directly from Amazon's own data. If you have access to Brand Analytics, SFR tells you not just how many people search a term, but exactly how it ranks against every other search query on the platform during the same period.
This guide covers what SFR means, how to read it, how to track it across multiple keywords over time using Brand Analytics and a comparison template, and how to connect SFR data to actual listing and advertising decisions.
What Is Amazon Search Frequency Rank (SFR)?
Amazon Search Frequency Rank is a metric available in Brand Analytics that reflects the relative popularity of a specific keyword on Amazon. It measures how often a keyword is searched by customers, ranked against all other search terms on the platform during a selected time period — typically the last 30 days.
Lower SFR = higher search volume. Higher SFR = lower search volume. An SFR of 1 means that keyword was the single most searched term on all of Amazon during that period. An SFR of 500,000 means 499,999 terms were searched more frequently than it.
Amazon SFR Quick Reference: What the Numbers Mean
| SFR Range | Search Volume Level | What It Means for Sellers |
|---|---|---|
| 1 – 5,000 | Extremely high | Massive traffic potential — highly competitive. Usually broad generic terms (e.g., "water bottle", "headphones"). |
| 5,001 – 50,000 | Very high | Primary category keywords. Strong traffic, strong competition. These should be in your title and top bullet. |
| 50,001 – 200,000 | High | Specific, intent-driven searches. Good targets for manual PPC campaigns and bullet points. |
| 200,001 – 500,000 | Medium | Long-tail keywords. Lower competition, lower traffic — but often high conversion rate. Ideal for backend search terms. |
| Above 500,000 | Low | Very niche or low-frequency terms. May indicate a highly specific use case — evaluate conversion potential before targeting. |
SFR is most useful when tracked over time — a single snapshot tells you the current state, but the trend (improving, declining, seasonal) tells you how to act. A keyword moving from SFR 80,000 to SFR 30,000 over three months signals growing demand — a good time to bid more aggressively before competitors notice the same trend.
SFR vs Search Volume: What's the Difference?
Many sellers confuse SFR with actual search volume. They measure different things:
| Metric | What It Measures | Source |
|---|---|---|
| SFR (Search Frequency Rank) | Relative rank of a keyword vs all other search terms on Amazon in that period | Amazon Brand Analytics — first-party data |
| Search Volume (Monthly) | Estimated number of times a keyword is searched per month | Third-party tools (Helium 10, Jungle Scout) — estimated data |
SFR doesn't tell you the absolute number of monthly searches — it tells you how that keyword ranks relative to others. A keyword with SFR 10,000 is searched far more often than one with SFR 500,000, but you need third-party tools to estimate the actual monthly search volume number. The advantage of SFR is that it's Amazon's own measurement — more accurate than any external estimate, especially for seasonal shifts and emerging trends.
Why Tracking SFR Matters for Amazon Sellers
Optimize keyword strategy: Knowing which keywords drive the most traffic to your category lets you prioritize where to place them — title vs bullets vs backend search terms — and how much to bid in PPC.
Monitor keyword trends: Comparing SFR across periods shows which keywords are gaining or losing popularity — useful for catching seasonal spikes early and adjusting inventory and ad budgets in advance.
Evaluate campaign performance: If you're bidding on a keyword and its SFR has climbed (demand dropped), that keyword's performance decline may be a market trend, not a listing quality issue.
Find content gaps: High-SFR keywords your listing doesn't rank for organically are prime candidates for PPC investment.
How to Track Amazon SFR for Multiple Keywords Efficiently
Tracking SFR across dozens of keywords and multiple time periods manually is time-consuming. A structured approach with a comparison template cuts the analysis time significantly.
Step 1: Download Brand Analytics Data
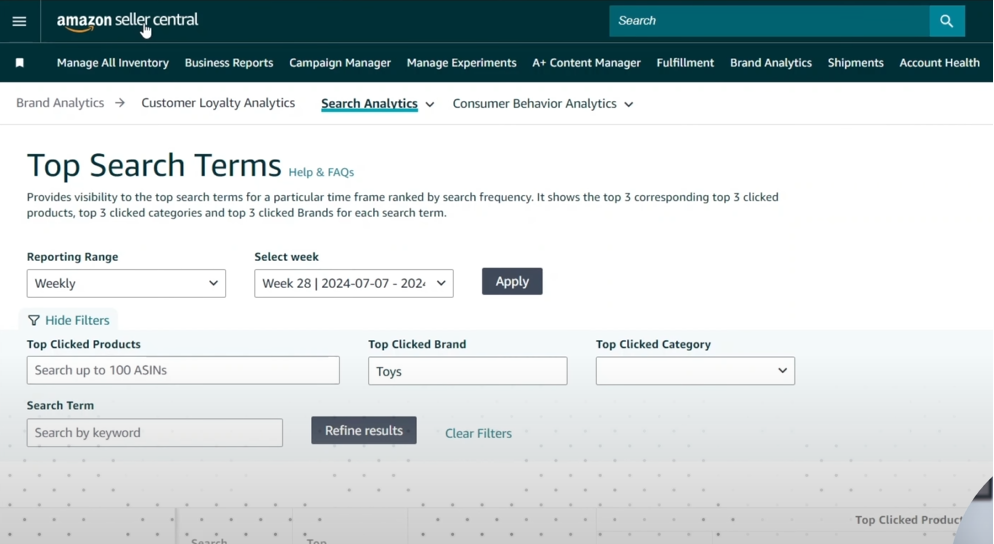
Log in to Amazon Seller Central
Go to Brands → Brand Analytics (available to Brand Registry-enrolled sellers only)
Select Amazon Search Terms from the left navigation
Choose your reporting period — weekly, monthly, or quarterly. Monthly is recommended for trend analysis.
Click Download to export the report as a CSV
The downloaded file includes each keyword's SFR, click share for the top 3 products, and conversion share for those products — giving you competitive intelligence alongside the raw SFR numbers.
Step 2: Prepare the SFR Tracking Template

Set up your tracking spreadsheet in Google Sheets or Excel with these sheets:
Open the SFR tracking template (or create your own with the structure below)
In the Current Period Data sheet, paste the Brand Analytics report you downloaded. Focus on the Keyword and Search Frequency Rank columns.
In the Comparison Period Data sheet, paste the data from the previous period (e.g., last month) using the same format
Step 3: Download and Paste Comparison Data
Return to Brand Analytics and change the reporting period to your previous period — last month if you're comparing month-over-month, or the same period last year for seasonal comparison. Download the report and paste the SFR column into the Comparison Period Data sheet.
Step 4: Analyze the SFR Data
In the SFR Analysis sheet, add the keywords you want to track. The template pulls SFR from both periods and calculates the change automatically. Review three columns for each keyword:
Current SFR: The keyword's rank in the current period
Comparison SFR: The keyword's rank in the previous period
SFR Growth: The difference between periods. A positive number means SFR increased (demand declined). A negative number means SFR decreased (demand grew).
How to Use SFR Data for Amazon PPC Decisions
SFR analysis becomes significantly more valuable when it drives PPC campaign decisions, not just listing changes. Here's how:
Increase bids on improving keywords: When a keyword's SFR is declining (demand growing) and you're not yet ranking organically for it, this is the right time to increase your PPC bid and capture traffic before competitors do the same.
Reduce bids on declining keywords: A keyword whose SFR is increasing month-over-month (demand dropping) may warrant a bid reduction. Continue monitoring rather than pausing — seasonal declines often reverse.
Add high-SFR terms as negative keywords: Keywords with very high SFR that are generating impressions but zero conversions in your campaign often indicate a mismatch between what the buyer is searching for and what you're selling. Add these as exact-match negatives.
Prioritize SFR 5,000–50,000 keywords for title placement: These represent the sweet spot of significant traffic without the extreme competition of the top 5,000 terms. If a keyword in this range appears in your Brand Analytics data with strong click share, it belongs in your product title.
Advanced SFR Tracking Strategies
Segment by Product Category
If you sell across multiple categories, track SFR separately for each. A keyword with SFR 30,000 in Electronics represents far more absolute search volume than the same SFR in a smaller category like Musical Instruments. Category context matters when prioritizing which keywords to invest in.
Track Competitor Click Share
Brand Analytics shows the top 3 products for each keyword and their click share percentage. If competitors are capturing 40%+ of clicks on a keyword you want to rank for, examine their listings — title, images, pricing, review count — before bidding heavily on that term. Winning impressions on a keyword where the competition converts much better won't improve your results.
Focus on Long-Tail Keywords
Long-tail keywords (SFR 100,000–500,000) are less competitive and often indicate specific purchase intent. A buyer searching "stainless steel insulated water bottle 32oz leak proof" is further down the purchase funnel than someone searching "water bottle." Tracking SFR for long-tail terms helps identify profitable niches with manageable competition.
Compare SFR Quarter-over-Quarter for Seasonal Planning
Comparing the same quarter year-over-year reveals seasonal demand patterns for your keywords. If a keyword drops from SFR 15,000 in October to SFR 80,000 in February consistently, that's actionable — you know to build inventory and increase bids in advance of the Q4 spike, not during it.
What If You Don't Have Access to Brand Analytics?
Brand Analytics is only available to sellers enrolled in Amazon Brand Registry. If you haven't enrolled yet, here are alternatives for keyword frequency tracking:
Amazon's Search Term Report (all sellers): In Seller Central → Reports → Advertising Reports → Search Term Report. This shows which actual customer search terms triggered your ads, along with impressions, clicks, and conversions. It doesn't give SFR, but it gives real performance data for terms that are already generating traffic to your listings.
Amazon autocomplete: Type your seed keyword into Amazon's search bar and note the autocomplete suggestions. Amazon ranks these by popularity — the first suggestion has the highest search frequency. Not quantitative, but directionally accurate.
Third-party tools: Helium 10's Cerebro and Magnet tools provide estimated monthly search volume and keyword trend data. These are estimates rather than first-party Amazon data, but useful for initial keyword research before Brand Registry access.
Frequently Asked Questions
What is Amazon Search Frequency Rank (SFR)?
Amazon Search Frequency Rank (SFR) is a metric in Brand Analytics that shows how a specific keyword ranks in popularity compared to all other search terms on Amazon during a chosen period. A lower SFR means higher search frequency — an SFR of 1 is the most searched term. An SFR of 500,000 means 499,999 other terms were searched more often during that period. SFR is Amazon's own first-party measurement, making it more accurate than third-party search volume estimates.
How do I access Amazon Search Frequency Rank data?
SFR data is available through Amazon Brand Analytics, which requires Brand Registry enrollment. In Seller Central, go to Brands → Brand Analytics → Amazon Search Terms. Select your reporting period (weekly, monthly, or quarterly), then download the report as a CSV. The file includes SFR for every keyword, along with click share and conversion share for the top 3 products for each term.
What is a good Amazon Search Frequency Rank?
There's no single "good" SFR — it depends on your category and strategy. For primary keywords you want in your title, targeting SFR in the 5,000–50,000 range balances meaningful traffic with manageable competition. Long-tail keywords in the 100,000–500,000 range offer lower competition and often higher purchase intent, making them strong candidates for PPC campaigns and backend search terms. Keywords above SFR 500,000 are niche and low-traffic — evaluate whether the specific intent justifies targeting them.
How often should I track Amazon SFR?
Monthly tracking is sufficient for most sellers. Download your Brand Analytics data at the end of each month, compare it to the previous month, and note which keywords improved (SFR decreased) or declined (SFR increased). For categories with strong seasonal demand, add a quarterly comparison against the same period the prior year to catch seasonal shifts early enough to adjust inventory and ad spend in advance.
Can I track competitor keywords using Amazon Brand Analytics?
Yes. Brand Analytics shows the top 3 products that received the most clicks for each search term, along with their click share and conversion share percentages. By searching terms relevant to your category, you can see which competitor ASINs are capturing the most clicks and traffic — and at what share. This is valuable for understanding where competitors are strongest and identifying terms where your products can realistically compete for clicks.
Need Help Turning Keyword Data Into Sales Growth?
SFR analysis gives you the data — turning it into higher rankings, better-performing campaigns, and growing organic traffic takes the right execution. At YourSeller Agency, we use Brand Analytics data as part of our Amazon listing and cataloging to identify which keywords to target, when to bid up, and when to cut spend — backed by Amazon's own search data rather than third-party estimates.
Our ongoing Amazon marketplace management includes monthly SFR tracking, campaign optimization, and listing updates as keyword trends shift.
