
Amazon Marketplace Management KPI Dashboard: The Metrics Every Seller Should Track Weekly
Amazon sellers cannot rely on guesswork to grow their business. The platform changes rapidly, and competition is fierce. A structured approach to Amazon marketplace management helps sellers track performance and avoid blind spots.
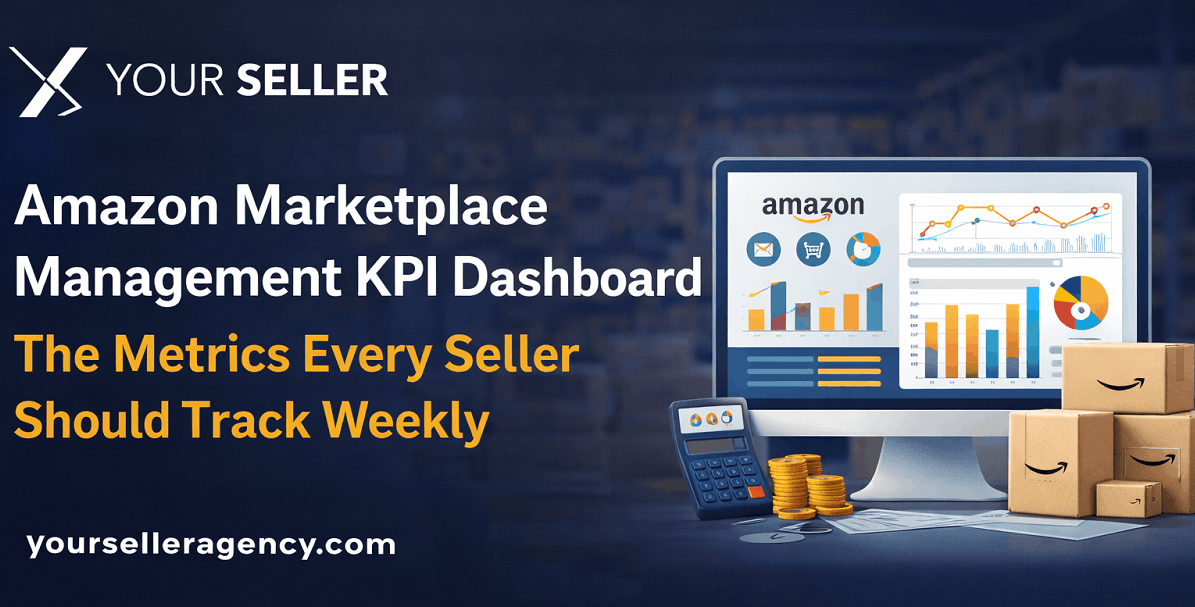
Building a weekly KPI dashboard offers a simple way to monitor growth, profitability, inventory health, and account stability. This guide is different from a basic software feature walkthrough. It focuses strictly on the metrics sellers must monitor to make profitable decisions.
You will learn what to track across traffic, conversion, advertising, inventory, and account health. When you review these numbers every seven days, you stop reacting to problems and start predicting them. This consistency separates struggling sellers from top-performing brands.
What Is an Amazon KPI Dashboard
A KPI dashboard is not a single software tool. It is a unified reporting system that combines data from Amazon Seller Central reports and other reliable sources.
Sellers often waste hours pulling different reports from various tabs. A dashboard brings all critical metrics into one weekly view. This setup leads to better decision-making and faster action. When all the numbers sit side by side, you can instantly see how ad spend affects overall sales or how low inventory hurts conversion rates.
Why Amazon Sellers Need a Weekly Dashboard
Weekly tracking helps you catch problems early. If traffic drops on a Tuesday, you can fix the issue by Friday. It makes it much easier to compare trends instead of reacting too late when sales have already plummeted. Furthermore, a weekly review supports smarter planning for your inventory orders, advertising budgets, and listing updates.
Top Traffic Metrics to Track for Effective Amazon Marketplace Management
Traffic represents the top-of-funnel portion of your business. This category of metrics tells you whether shoppers are actually finding and viewing your products.
1. Sessions
Sessions indicate the total number of unique visitors who view your product pages within 24 hours. This metric matters because it shows actual demand and visibility. Many sellers panic over low sales, but a weekly check often reveals that the real issue is a sudden drop in sessions week over week. If shoppers cannot find you, they cannot buy from you.
2. Page Views
Page views differ slightly from sessions. A session counts one unique visitor, while page views count the total number of times your page was loaded. If page views are much higher than sessions, it reveals strong listing interest. Customers are returning to your page multiple times to read reviews or check details before making a final purchase decision.
3. Click-Through Rate
Click-Through Rate measures how often people click on your product after seeing it in search results. This metric matters heavily for product visibility and keyword relevance. Strong main images, clear titles, and competitive pricing directly boost your click-through rate. If your impressions are deep but this metric is low, your product does not look appealing in the search results.
The Conversion Metrics That Show Whether Listings Sell
Traffic alone will not build a profitable business. You need to know whether those visitors are actually turning into paying buyers.
1. Unit Session Percentage
Unit session percentage is Amazon's specific term for conversion rate. It calculates how many units you sell per customer session. This is one of the most important conversion indicators in your entire dashboard. A high number means your product page is highly persuasive and correctly priced.
2. Conversion Rate by ASIN
You must identify which specific products convert well and which ones fail. Tracking conversion rate, Amazon style, by individual ASIN helps you isolate problems. If one product has high traffic but terrible conversions, you know where to prioritize professional Amazon listing services to rewrite the copy or upgrade the images.
3. Revenue per ASIN
Revenue must be tracked at the individual product level. This granular view helps you uncover your true hero products and your hidden underperformers. Sometimes a product sells many units but generates very little revenue due to deep discounts. Tracking this ensures you focus your energy on items that drive business growth.
How Amazon Marketplace Management Tactics Influence Pricing and the Buy Box
Pricing and Buy Box shares have a direct and significant impact on your daily sales volume. Monitoring these metrics is essential for competitive Amazon marketplace management.
1. Buy Box Percentage
Buy Box percentage shows how often your specific offer is selected when a customer clicks the Add to Cart button. Winning the Buy Box matters entirely for visibility and conversions. If this number drops below 95% on a private label product, you likely have a hijacker or a pricing error.
2. Pricing Competitiveness
You must track price changes against your competitors constantly. While dropping prices can boost short-term sales, you must watch out for margin erosion caused by endless discounting. A good dashboard flags when your price drops too low to remain profitable.
3. Featured Offer Losses
Losing the Buy Box can reduce sales to zero even when your listing remains perfectly active. This happens if Amazon thinks your price is too high compared to other websites. Tracking featured offer losses weekly allows you to adjust pricing rules before you lose thousands of dollars in potential revenue.
Inventory Health Metrics Every Seller Must Review Weekly
Inventory mismanagement is one of the biggest operational risks you face. These practical metrics keep your supply chain running smoothly.
1. Weeks of Cover
Weeks of cover tells you how long your current stock will last based on your recent sales velocity. This metric matters because it helps you prevent both stockouts and expensive overstock situations. If you have only two weeks of cover left, it is time to expedite a shipment immediately.
2. Stockout Risk
Out-of-stock products destroy your sales momentum and ruin your organic ranking. Weekly checks are far better than monthly reviews because Amazon sales velocities change rapidly. Catching a stockout risk early allows you to slow down advertising or raise prices slightly to preserve inventory.
3. Inventory Turnover
Inventory turnover explains how fast your stock is moving out of Amazon fulfillment centers. This heavily affects your business cash flow and storage efficiency. Slow-moving stock ties up your capital and incurs high long-term storage fees.
4. Suppressed or Unavailable Inventory
You must track listings that are stranded, not active, or not purchasable. This directly links to your listing quality and operational discipline. Often, sellers send inventory to Amazon only to discover weeks later that the listing was suppressed due to a missing product attribute.
5. FBA Sell-Through Rate
This is the metric Amazon uses to calculate the IPI (Inventory Performance Index) score. Tracking how well inventory moves relative to current stock levels is critical because a low sell-through rate directly triggers strict storage limit restrictions.
6. Excess Inventory Percentage
It is not just about running out of stock; it is about capital being trapped. Highlighting the percentage of stock that is over 90 days old helps sellers identify which ASINs need liquidation, outlet deals, or aggressive ad pushes.
Advertising Metrics That Reveal Efficient Amazon Growth
Ad performance is a central pillar of Amazon marketplace management. Spending money without tracking these specific numbers guarantees a wasted budget.
1. ACOS
Advertising Cost of Sales defines how much you spend on ads to generate one dollar of ad revenue. This metric matters deeply for profitability. High ACOS means your ads are eating your profit margins. Reviewing this weekly helps you pause bleeding keywords before they drain your bank account.
2. TACOS
Total Advertising Cost of Sales gives a much broader view of your ad impact. It measures ad spend against your total overall sales. This connects your paid efforts and your organic growth. A healthy account usually sees ACOS fluctuate while TACOS remains steady and low.
3. CPC
Cost per click needs weekly monitoring because the advertising landscape is highly volatile. A rising CPC can indicate new aggressive competitors entering your niche. If clicks become too expensive, you may need to shift budget to longer-tail keywords to maintain profitability.
4. ROAS
Return on ad spend shows your campaign efficiency. It is the inverse of ACOS. Use this metric to clearly separate your winning campaigns from your wasting campaigns. A high ROAS means you should probably increase the daily budget for that specific ad group.
5. Top of Search Impression Share
Spending money is one thing, but knowing if your ads are securing the absolute best real estate is another. Tracking this metric reveals if competitors are systematically outbidding you for the highest-converting placements at the very top of page one.
6. New-to-Brand (NTB) Orders
For sellers using Sponsored Brands or Sponsored Display ads, this metric separates true business growth from repeat purchases. It proves whether the advertising budget is actively acquiring fresh market share or just cannibalizing organic customer loyalty.
What to Track for Listing Quality and Optimization
Optimization is never a one-time task. You must measure listing quality weekly to ensure peak performance.
1. Title and Keyword Performance
You must check whether your current titles are helping visibility. Track keyword movement and relevance organically. If your organic rank drops for a primary search term, your title or backend search terms might need an immediate refresh.
2. Bullet Point and Image Effectiveness
Content quality heavily affects both clicks and conversions. Poor listing content often leads to weak performance even when your traffic numbers look great. If sessions are up but conversions are down, expert Amazon listing services can help you design infographics that actually explain the product benefits clearly.
3. Child ASIN Performance in Variation Families
You should always track performance by specific size, color, pack quantity, or style. Use this weekly data to find your absolute best-selling variation and your weakest one. You can then direct your ad spend exclusively to the winning child ASIN to maximize overall returns.
Account Health and Compliance Metrics That Protect Growth
A healthy account is the foundation of sustainable growth. Operational metrics matter just as much as your daily sales numbers.
1. Order Defect Rate
This metric matters immensely for account stability. It tracks negative feedback and chargebacks. If this goes over 1%, you risk losing your selling privileges entirely.
2. Late Shipment Rate
For sellers fulfilling their own orders, this shows the importance of performance metrics and customer trust. Shipping late ruins the buyer experience and puts your account at immediate risk of suspension.
3. Cancellation Rate
High cancellations signal deep operational problems. It usually means you are selling items you do not have in stock. Keep this under 2.5% to stay safe.
4. Policy Violations and Listing Suppressions
Sellers should review the account health dashboard weekly to avoid sudden disruptions. Amazon bots frequently flag listings for restricted keywords or minor policy violations. Catching these early prevents your top seller from being taken down on a busy weekend.
How to Compare Performance Across Amazon US, UK, and India
Brands operating in more than one marketplace need specific tracking. Each marketplace behaves completely differently, even for the same product.
1. Compare Traffic Trends
Determine which market is getting more overall visibility. You might find that your product gets huge traffic in the US but struggles for impressions in the UK. This tells you where to push brand awareness campaigns.
2. Compare Conversion Rates
Find out which market has stronger buyer intent. A product might convert at 20% in India but only 8% in the US due to different cultural preferences or local competition.
3. Compare Inventory Pressure
Identify which region needs better restocking support. Fast-moving markets require larger shipments and more frequent factory orders. Comparing inventory health with Amazon data globally prevents local stockouts.
4. Compare Ad Efficiency
Look at where your ad spend delivers the absolute best returns. If advertising is incredibly cheap and profitable in the UK, you might want to temporarily shift budget away from a highly saturated US market.
How an Amazon Growth Agency Uses KPI Dashboards
A professional Amazon growth agency does much more than just report raw numbers to clients. They use a KPI dashboard Amazon system, to uncover the actual story behind the data.
1. Prioritizing the Right Metrics
Traffic, conversion, inventory, ads, and account health all matter. However, the agency should focus on identifying the current bottleneck first. If conversion is broken, driving more traffic is a waste of money.
2. Turn Data Into Weekly Action Plans
Agencies take dashboard numbers and create immediate tasks. For example, if CTR is low, the action plan is to split-test the main image. If ACOS is high, the action plan is to lower bids on match keywords.
3. Why Brands Outsource Dashboard Management
Brands outsource this to an agency because it saves massive amounts of time. It improves execution consistency and drastically reduces emotional, reactive decision-making based on daily sales fluctuations.
A Simple Weekly KPI Dashboard Template for Amazon Sellers
Use this straightforward checklist to know which numbers to gather at the start of your week:
Must-Track Weekly Metrics
Sessions
Page views
Unit session percentage
Total Revenue
Buy Box percentage
Stockout risk percentage
ACOS and TACOS
Account health policy alerts
Optional Advanced Metrics
Individual variation in family performance
Organic keyword rank movement
Market-by-market regional comparison
Stranded inventory and suppression alerts
Common Mistakes Sellers Make When Tracking Amazon KPIs
Many sellers fail because they track way too many metrics at once, which leads to analysis paralysis. Another major error is looking only at top-line revenue while completely ignoring profitability and rising ad costs.
Furthermore, ignoring inventory data until stockouts actually happen is a fatal mistake that ruins product ranking. Reviewing data monthly instead of weekly allows small issues to turn into significant financial losses. Finally, looking at numbers without linking those metrics to clear, specific action steps renders the entire dashboard useless.
Conclusion
Tracking the right data is the only reliable way to scale an e-commerce business. Building a disciplined weekly tracking routine forces you to confront the reality of your account health, ad efficiency, and listing quality.
Stop managing your brand on intuition. Let an expert Amazon growth agency turn your weekly KPIs into higher sales, better margins, and dominant market positioning today.
Frequently Asked Questions
1. What is an Amazon KPI dashboard?
It is a centralized reporting system that tracks critical metrics like traffic, conversion rates, ad spend, and inventory health to help sellers make data-driven decisions.
2. How often should Amazon KPIs be tracked?
Sellers should review their core KPIs weekly to catch sudden drops in traffic, fix ad overspend early, and prevent unexpected inventory stockouts.
3. Which conversion rate metric matters most on Amazon?
Unit Session Percentage is the primary conversion metric. It reveals how many units are purchased relative to the number of customer visits your listing receives.
4. Can I use Seller Central to build my dashboard?
Yes, but you will have to manually download and combine several different reports every week. Most growing brands prefer automated software or partner with an agency to compile this data and save time.
Let an Amazon Growth Agency Turn Your Weekly KPIs Into Higher Sales
Data collection is only half the battle. If those weekly numbers fail to generate more revenue, you need a different strategy. Stop the endless spreadsheet reviews and late reactions to sudden traffic drops. You need clear action plans over raw data. Let a professional Amazon growth agency turn your weekly KPIs into higher sales. At YourSeller, our team deeply analyzes your core metrics to uncover hidden profit leaks, optimize weak product pages, and scale your best ad campaigns.
Partner with our experts right now to build a highly profitable and completely stress-free business. Call us at +91 9909513312 or drop us an email at contact@yourseller.in for a quick expert consultation.